With the Facebook (FB) IPO expected to begin trading on Friday as the one of the most hyped, talked about and biggest internet IPO in history, I thought it would be a good time to review IPO trading strategies which not only applies to the Facebook IPO, but to all IPO’s. It’s a strategy I’ve been discussing for awhile now, first posting about the strategy in 2006 and then again during the Visa IPO in 2008. It’s a time tested strategy that works very well, taking the emotion out of an IPO trade and increasing your chances of success.
====> Get Your Daily Facebook Trend Analysis Here
The big money has already been made in Facebook by executives and early investors. By the time the IPO hits the public market Friday morning opening up with a big gap off the offer price, the risk will be considerably higher with diminished reward potential. Having said that though, let’s remember that stocks can soar based on hype and potential alone. The fundamental guys can make valuation comparisons, but let’s also remember that young growth companies can trade at extreme valuations in the early years before settling out to more reasonable valuations. Sure, from an expected valuation standpoint, from a slowing revenue standpoint, from a recent large acquisition of Instagram standpoint, from a…. You get the picture. I agree. Based on these reasons and several more, I flat out would not put on a large position in Facebook and hold it for a number of years. I do however believe Facebook (FB) will provide for a great shorter term trading stock (a few weeks to months).
That’s where my technical strategy comes into play. The key is focusing on nothing more than supply and demand which is revealed in the chart. Take the emotion and hype out of the Facebook IPO trade completely. There will be a tendency for the novice trader/investor to want to jump into FB in the opening minutes believing they will make a fortune. Avoid this!
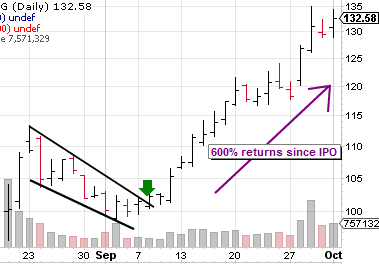
There are a few important chart patterns to look out for and the hottest IPO’s typically carve out patterns with fairly short consolidation patterns. I like to see at least 10 trading days of consolidation. One pattern I look for is a flat base type of pattern where the stock runs up in the first few days then trades in a tight range sideways for a couple of weeks. The more likely chart pattern for Facebook (FB) is some kind of triangle pattern or flag pattern where the stock runs up quickly over 1-3 days then consolidates in a more volatile pattern up and down to form a triangle, or consolidates downward in a tighter range to form a flag type pattern. Take a look at the chart below which highlights a bullish flag pattern. Here’s a hint: the IPO debuted in 2004 and the company starts with a “G”. Yeah, OK that’s the chart of Google’s IPO back in 2004 and it highlights perfectly a big run up in the first 3 days followed by a consolidation period (in this case 10 trading days) to form a flag pattern, before breaking out and never looking back. The stock is up 600% since.
I’m not saying Facebook (FB) is going to mimic the chart of Google, I just thought I’d compare it since everyone seems to want to compare the two AND it illustrates a pattern that Facebook may resemble (at least initially). While you can get lucky by jumping into the FB IPO at the beginning of trading Friday morning and scoring a quick gain, the safer bet is to wait a few weeks for that first base formation to form and get in on the breakout. That’s the gist. I’ll be taking a look at the chart of the Facebook (FB) IPO once again after several days of trading and certainly highlight it here again should it breakout from an important base. At any rate, it should be a fun stock to watch particularly as it reacts to news events.
