If you’ve had the TV on at all in the last week or logged into your brokerage account, then you know darn well that the stock market action has been downright ugly and looking a lot like the action during the stock market crash of 2008 and on into 2009. Many want to know what they should do and are anxious about just how far this market drop will go. I’ve been getting an increase in emails about my opinion on this market and thought I would share them here. Granted, this is a site focused on green stocks, but considering 70% of stocks move with the overall market, it’s important to review the overall market from time to time which is something I haven’t done a lot of here.
I’d first like to say that panicking leads to irrational decisions. It’s easier said than done particularly on days when the stock market is down over 6% and down nearly 20% in just two weeks time, but remain calm and avoid selling positions into fear. If you began lightening up several days ago when key support levels were broken good for you. Believe it or not, in the big picture view, this selling is quite normal given the run off the 2009 bottom. We were well overdue for a healthy correction particularly given the lack of meaningful job creation and soaring debt. Add in our inept government officials and you have a recipe for a sell off.
What if you haven’t eased up on your stock exposure and are looking for a place to exit? For those of you who have held on with white knuckles, anxious about where to lighten up, I always say look for a bounce to sell into after a big drop. The first opportunity to sell was when the Dow busted through the 200 day moving average just below the 12,000 level, but if you’re still all in, it’s too late. While I believe there is room to run to the downside of a few percent (2-3%) during this leg down (possibly early tomorrow), I also believe we’ll get a relief rally very soon and likely this week. If it begins with massive capitulation (huge high volume reversal with a close in the green), then the bounce could be meaningful and would offer many a chance to lighten the load.
For today, let’s take a look at the Dow Jones and S&P500 ETF charts (DIA & SPY) to get an idea of where we’ve come and where we might be headed.
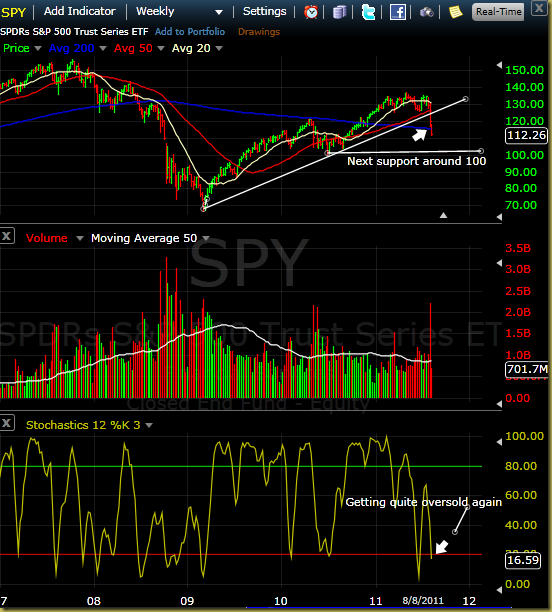
The weekly chart of the SPY is below and note that this ETF correlates about 1:10 to the S&P500. I prefer analyzing ETF’s because they provide volume levels. After a big move I like to step back and take a look at a longer time frame chart such as the weekly. Notice on this weekly chart that the upward trend line off the 2009 low has now been broke, which signals a rough go in the markets over the next several months. .. at least. Any bounce should be used to sell/short into. Today’s move was a bit troubling because the SPY took out the next level of support at the 200 weekly average (blue line) which means more pain may be needed before a meaningful bounce can take place. I’m watching the 110 level tomorrow. Considering the market finished near the lows of the trading session today with very heavy volume, we could see that move to the 110 level at the open tomorrow. Should that kind of move take place, begin looking for a big capitulation move which would be characterized by heavy intraday volume to the upside. Please know I just see this area as a rest area and that ultimately we are likely headed to SPY and DIA 100. It’s not until this area is reached that I would look to be doing some buying.
::::: > Get A Free Daily SPY Analysis Here
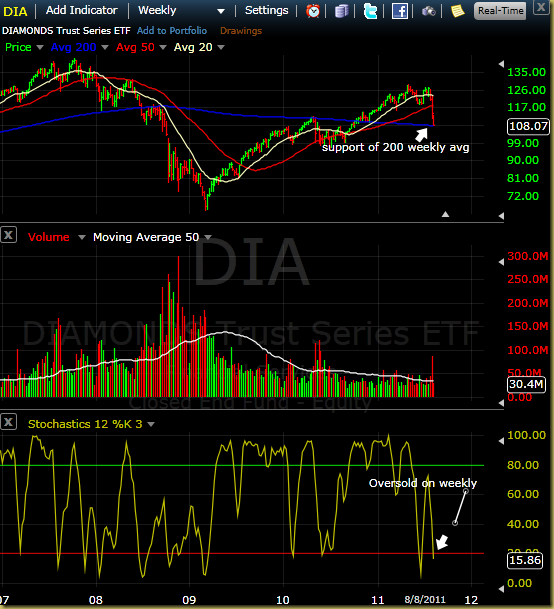
The Dow ETF (DIA) is testing its support area of the 200 weekly average (blue line) right here so it will be interesting to see how trading develops around that level tomorrow. Tomorrow is a really important day. If we open up down significantly again tomorrow, we must see buyers come in and support this market with conviction within the first few hours or we’re going to wipe out more key support. Notice on both the weekly charts of the SPY and DIA that we’re considerably oversold according to stochastics readings. Typically when you get to these levels the market trades sideways to up for a few weeks. As I said above, I think we’re quite close to that kind of trading action.

